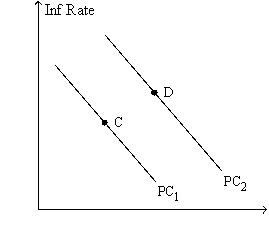
Figure 36-8.The left-hand graph shows a short-run aggregate-supply (SRAS) curve and two aggregate-demand (AD) curves.On the right-hand diagram,"Inf Rate" means "Inflation Rate." 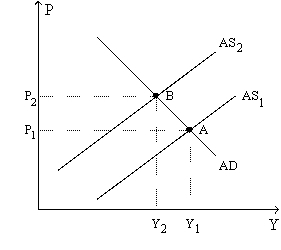
-Refer to Figure 36-8.The shift of the aggregate-supply curve from AS1 to AS2
A) results in a more favorable trade-off between inflation and unemployment.
B) results in a more favorable trade-off between inflation and the growth rate of real GDP.
C) represents an adverse shock to aggregate supply.
D) represents a favorable shock to aggregate supply.
Correct Answer:
Verified
Q1: An event that directly affects firms' costs
Q30: If people eventually adjust their inflation expectations
Q31: Figure 36-8.The left-hand graph shows a short-run
Q31: Which of the following is correct if
Q34: Which of the following would cause the
Q106: In the long run,an increase in the
Q125: In the nineteenth century,some countries were on
Q133: If a government redesigned its unemployment insurance
Q175: In the long run, a decrease in
Q213: Disinflation is defined as a
A)zero rate of
Unlock this Answer For Free Now!
View this answer and more for free by performing one of the following actions

Scan the QR code to install the App and get 2 free unlocks

Unlock quizzes for free by uploading documents