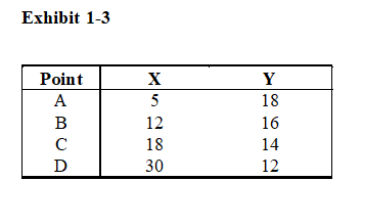
-Refer to Exhibit 1-3.According to the data provided in this table,what is the approximate slope of the line between points A and B,if these data were graphed with X on the horizontal axis and Y on the vertical axis?
A) -0.29
B) -3.50
C) 0.29
D) 3.50
E) none of the above
Correct Answer:
Verified
Q148: Elite colleges and universities use standardized test
Q149: Which of the following statements uses the
Q150: The coordinates of point A are 30
Q151: A three-word synonym for the term ceteris
Q152: A theory is
A) built on the major
Q154: Ceteris paribus means
A) "one variable too many."
B)
Q155: Something that motivates or encourages people to
Q156: The purpose of the ceteris paribus assumption
Q157: A theory is an abstract representation of
Q158: The condition often used in economics to
Unlock this Answer For Free Now!
View this answer and more for free by performing one of the following actions

Scan the QR code to install the App and get 2 free unlocks

Unlock quizzes for free by uploading documents