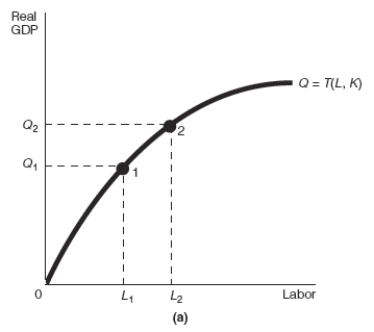
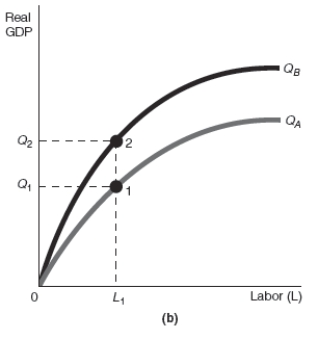
-Refer to Exhibit 17-2.Assume that the starting point is always point 1.Which of the production function graphs shown,(a) or (b) ,represents an increase in the quantity of labor,and which represents an increase in the quantity of capital,respectively?
A) (a) ; (a)
B) (b) ; (a)
C) (a) ; (b)
D) (b) ; (b)
Correct Answer:
Verified
Q56: Per-capita real economic growth refers to an
Q57: New growth theory holds technology to be
Q58: Research by Harvard economists Barro and McCleary
Q59: According to new growth theory,discovering and implementing
Q60: According to new growth theory,technological advances can
Q62: When interest rates in a given economy
Q63: Production Function
Real GDP = T (L,K),such that
Q64: In the production function Real GDP =
Q65: Production Function
Real GDP = T (L,K),such that
Q66: When a production function is graphed with
Unlock this Answer For Free Now!
View this answer and more for free by performing one of the following actions

Scan the QR code to install the App and get 2 free unlocks

Unlock quizzes for free by uploading documents