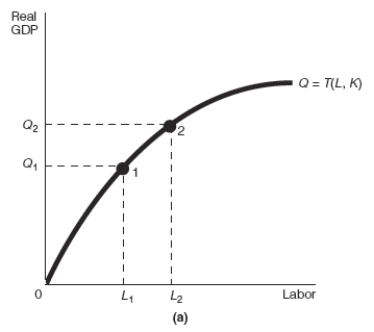
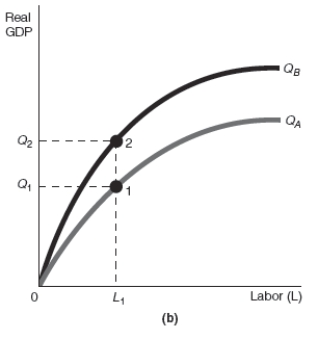
-Refer to Exhibit 17-2.Assume that the starting point is always point 1.Which of the production function graphs shown,(a) or (b) ,represents an increase in the quantity of labor,and which represents an increase in the technology coefficient,respectively?
A) (a) ; (b)
B) (b) ; (a)
C) (a) ; (a)
D) (b) ; (b)
Correct Answer:
Verified
Q70: In the production function Real GDP =
Q71: When a production function is graphed with
Q72: When a production function is graphed with
Q73: When taxes on the return to capital
Q74: When a production function is graphed with
Q76: Production Function
Real GDP = T (L,K),such that
Q77: Production Function
Real GDP = T (L,K),such that
Q78: Production Function
Real GDP = T (L,K),such that
Q79: When interest rates fall in a given
Q80: Suppose that the production function for an
Unlock this Answer For Free Now!
View this answer and more for free by performing one of the following actions

Scan the QR code to install the App and get 2 free unlocks

Unlock quizzes for free by uploading documents