Multiple Choice
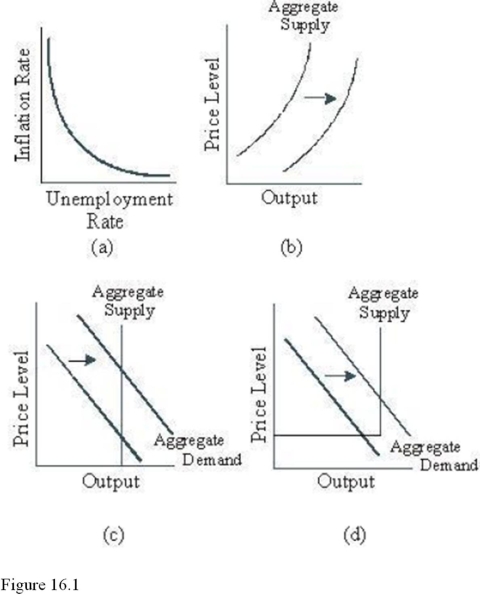 Choose the letter of the diagram in Figure 16.1 that represents the Phillips curve.
A) a.
B) b.
C) c.
D) D.The Phillips curve is a downward-sloping curve illustrating the inverse relationship between the unemployment rate and the rate of inflation.
Correct Answer:
Verified
Related Questions
Q96: When the U.S.Congress increased the immigration quota

