Graphed from 10,000 BCE to 2010,as shown below,the global human population 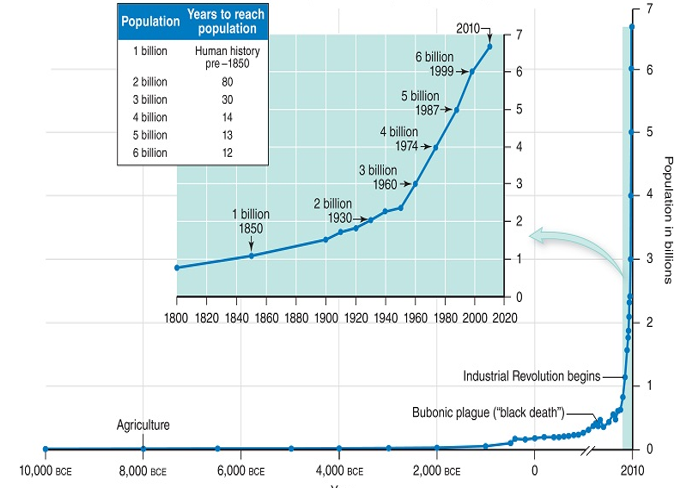
A) has reached 0% growth rate, as shown by the data plot at 2010.
B) shows the typical curve of logistic growth.
C) is showing clearly that humans are at Earth's carrying capacity for our species.
D) None of the answer choices are correct.
E) shows the typical curve of exponential growth.
Correct Answer:
Verified
Q31: When exponential growth is plotted over time
Q46: For a lady bug population at the
Q47: Atlantic mollies of the species Poecilia mexicana
Q48: Atlantic mollies of the species Poecilia mexicana
Q49: A J-shaped population growth curve indicates that
A)
Q51: How is the adaptation of investing more
Q52: A country's ecological footprint can be calculated
Q53: What key conclusion did Riesch and Schlupp
Q54: Immigration is the migration out of a
Q55: On the island of Guam,a single type
Unlock this Answer For Free Now!
View this answer and more for free by performing one of the following actions

Scan the QR code to install the App and get 2 free unlocks

Unlock quizzes for free by uploading documents