This figure shows graphed medical research results from a study on a new vaccine. The research was done in an effort to determine if a new vaccine would be effective at preventing potentially dangerous rotavirus infections in infants. Green data bars represent occurrence of infant cases that had normal rotavirus strains that aren't critically dangerous. Blue data bars represent occurrence of infant cases that had more dangerous rotavirus strains that can hospitalize or lead to fatality of infants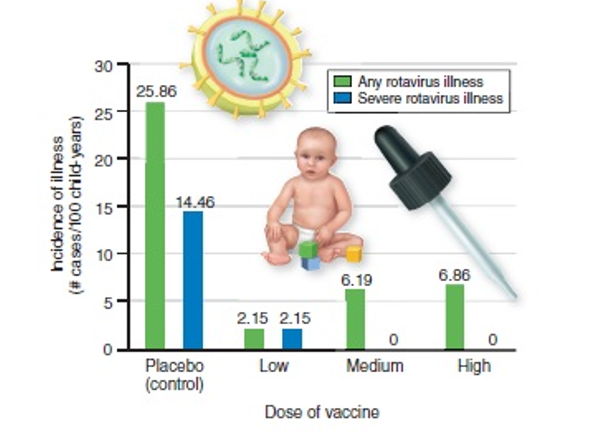
-In the graph,the X-axis is showing different doses of vaccine,including "placebo," "low," "medium" and "high." These levels of vaccine were applied to different groups of babies to test if and how much the vaccination helped reduce the incidence of rotavirus,an illness that can quickly dehydrate infants to critical or fatal levels.These doses represent
A) the independent variable in this medical study.
B) the standardized variable in this medical study.
C) the dependent variable in this medical study.
D) the control group of this medical study.
Correct Answer:
Verified
Q53: Charles Darwin,after observing variability among plant and
Q54: What did Charles Darwin propose after observing
Q55: The smallest scale of biological organization is
Q56: Darwin observed an orchid flower with petals
Q57: In an experiment designed to determine if
Q59: A theory is an advanced hypothesis that
Q60: Charles Darwin observed an orchid flower with
Q61: Evolution theory includes changes in the genetic
Q62: Scientific inquiry in biology is linked in
Q63: One researcher,Gregor Mendel,studied the genetics of pea
Unlock this Answer For Free Now!
View this answer and more for free by performing one of the following actions

Scan the QR code to install the App and get 2 free unlocks

Unlock quizzes for free by uploading documents