This figure shows graphed medical research results from a study on a new vaccine. The research was done in an effort to determine if a new vaccine would be effective at preventing potentially dangerous rotavirus infections in infants. Green data bars represent occurrence of infant cases that had normal rotavirus strains that aren't critically dangerous. Blue data bars represent occurrence of infant cases that had more dangerous rotavirus strains that can hospitalize or lead to fatality of infants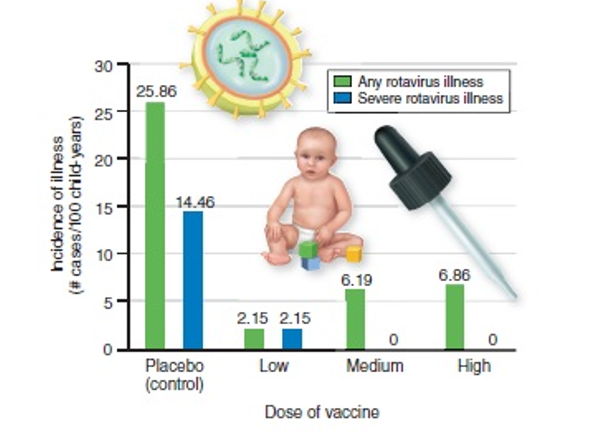
-In this experiment,if the people actually giving the placebo,low,medium or high vaccine doses did not know which dose they were administering,it was an example of a double-blind experiment.
Correct Answer:
Verified
Q41: In an experiment designed to determine if
Q42: This figure shows graphed medical research results
Q43: As part of observation in your scientific
Q44: You are feeling ill,so you visit a
Q45: Given basic information from observations of the
Q47: Decomposers are a special group of producers.
Q48: In an experiment designed to determine if
Q48: The cell is the basic unit of
Q49: What is the advantage to the sphinx
Q51: This figure shows graphed medical research results
Unlock this Answer For Free Now!
View this answer and more for free by performing one of the following actions

Scan the QR code to install the App and get 2 free unlocks

Unlock quizzes for free by uploading documents