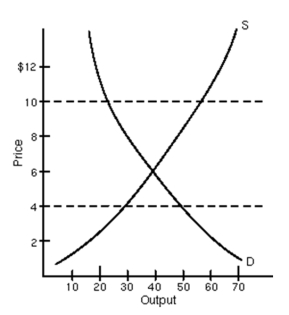
-The price of $10 in the graph above represents
A) a price floor.
B) a price ceiling.
C) either a price floor or a price ceiling.
D) neither a price floor nor a price ceiling.
Correct Answer:
Verified
Q59: Black markets emerge during times of
A)price floors.
B)price
Q60: When a market operates so that there
Q61: When a price floor that has an
Q62: A increase in the supply of loanable
Q63: When there is a price ceiling there
Q65: If the equilibrium price of an hour
Q66: During World War II,there was an extensive
Q67: Which statement is true?
A)Rent control is a
Q68: Gas lines were the result of
A)price ceilings.
B)price
Q69: When a price ceiling which had been
Unlock this Answer For Free Now!
View this answer and more for free by performing one of the following actions

Scan the QR code to install the App and get 2 free unlocks

Unlock quizzes for free by uploading documents