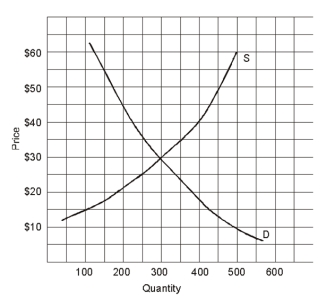
-In the graph shown above at a price of $38
A) there is a surplus.
B) there is a shortage.
C) quantity demanded is greater than quantity supplied.
D) there is a shortage and quantity demanded is greater than quantity supplied,but there is not a surplus.
E) there is a surplus and quantity demanded is greater than quantity supplied,but there is not a shortage.
Correct Answer:
Verified
Q155: Q156: When supply falls and demand stays the Q157: If government legislates a price floor that Q158: Q159: Q161: Interest rates would _ if the supply Q162: If price was set by the government Q163: When demand falls and supply rises,equilibrium price Q164: Q165: Unlock this Answer For Free Now! View this answer and more for free by performing one of the following actions Scan the QR code to install the App and get 2 free unlocks Unlock quizzes for free by uploading documents![]()
![]()
![]()

