This graph shows what causes 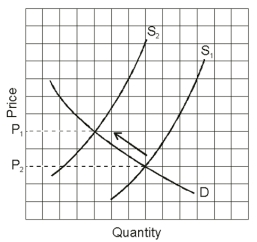
A) cost-push inflation.
B) demand-pull inflation.
C) neither cost-push nor demand-pull inflation.
D) Scrambling Locked
Correct Answer:
Verified
Q222: In the 1990s the misery index was
A)between
Q229: For nearly every year since 1992 our
Q230: Since 2006,our unemployment rate
A)rose.
B)fell.
C)stayed about the same.
Q232: This graph shows what causes 
Q233: Statement I: Social Security recipients are protected
Q234: In the 1990s our rate of inflation
Q236: Which is the most accurate statement?
A)The more
Q237: Statement I: Deflation and disinflation mean exactly
Q239: Two years ago,when her plant closed,Sue Ann
Q240: Imports tend to
A)raise our rate of inflation.
B)lower
Unlock this Answer For Free Now!
View this answer and more for free by performing one of the following actions

Scan the QR code to install the App and get 2 free unlocks

Unlock quizzes for free by uploading documents