Multiple Choice
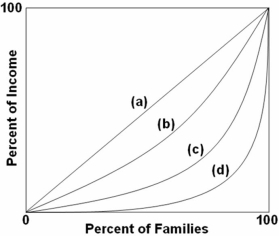 Refer to the above graph.The Gini ratio would be 0 for which curve?
A) a
B) b
C) c
D) d
Correct Answer:
Verified
Related Questions
Q18: Q20: In 2009,about what percentage of households had Q21: Q22: Q24: Q25: Q26: The Gini ratio is determined by: Q27: Complete income equality using the Gini ratio Unlock this Answer For Free Now! View this answer and more for free by performing one of the following actions Scan the QR code to install the App and get 2 free unlocks Unlock quizzes for free by uploading documents![]()
![]()
![]()
![]()
![]()
A) adding

