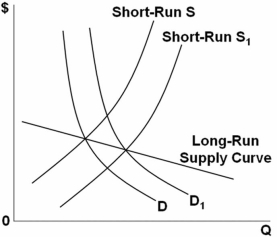
 The graph above represents a(n) :
A) decreasing-cost industry: firms may be paying lower prices for their inputs when the industry expands.
B) increasing-cost industry: firms may be paying higher prices for their inputs when the industry expands.
C) competitive,break-even industry: the long-run supply curve is upward sloping as it must be according to the law of supply.
D) constant-cost industry: prices of the inputs stay the same,and other production costs are constant as the industry expands.
Correct Answer:
Verified
Q15: Competitive firms are price takers largely because
Q113: Assume a purely competitive increasing-cost industry is
Q114: Assume a purely competitive increasing-cost industry is
Unlock this Answer For Free Now!
View this answer and more for free by performing one of the following actions

Scan the QR code to install the App and get 2 free unlocks

Unlock quizzes for free by uploading documents