Multiple Choice
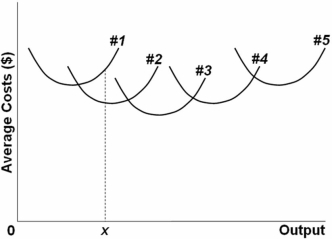 The above diagram shows the short-run average total cost curves for five different plant sizes of a firm.The position of these five curves in relation to one another reflects:
A) economies and diseconomies of scale.
B) the effect of fixed costs on ATC as output increases.
C) the law of constant costs.
D) the law of diminishing returns.
Correct Answer:
Verified
Related Questions
Q103: Which of the following is not a

