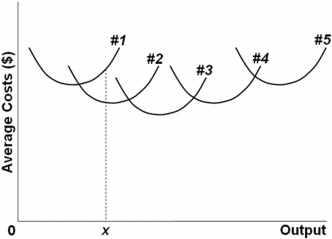
 The above diagram shows the short-run average total cost curves for five different plant sizes of a firm.In the long run the firm should produce output 0x with a plant of size:
A) #4.
B) #3.
C) #2.
D) #1.
Correct Answer:
Verified
Q116: Q117: The Sunshine Corporation finds its costs are Q118: Q119: The Sunshine Corporation finds its costs are Q121: Most business firms in the United States Q122: A major advantage of the corporate form Q123: Only the bondholders of a corporation have Q135: If a firm increases all of its Q243: Assume a firm closes down in the Q360: If a firm doubles its output in![]()
![]()
Unlock this Answer For Free Now!
View this answer and more for free by performing one of the following actions

Scan the QR code to install the App and get 2 free unlocks

Unlock quizzes for free by uploading documents