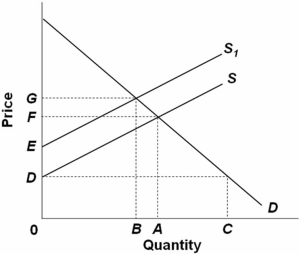
 Refer to the above supply and demand graph.In the graph,point A is the current equilibrium level of output of this product and point B is the optimal level of output from society's perspective.S is the supply curve without a tax and St is the supply curve with a tax.This figure indicates that there is (are) :
A) positive externalities created in the production of this product.
B) negative externalities created in the production of this product.
C) an underallocation of resources to product production.
D) a surplus of the good produced.
Correct Answer:
Verified
Q58: If the production of a product or
Q59: In a market where there are external
Q60: If there are positive externalities associated with
Q61: Which antipollution policy would be least likely

