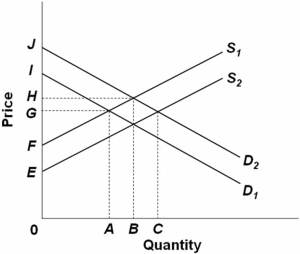
 Refer to the above supply and demand graph.Point A represents the current equilibrium level of output of this product and point B represents the optimal level of output from society's perspective.This supply and demand graph indicates that there is (are) :
A) spillover benefits to the production of this product.
B) spillover costs to the production of this product.
C) an overallocation of resources to the production of this product.
D) a negative externality from the production of this product.
Correct Answer:
Verified
Q67: In a market economy with well-defined property
Q68: Which is not one of the conditions
Q69: According to a study by economists Ian
Q70: One condition for individual bargaining to occur,according
Q71: An emission fee levied against polluters will
Unlock this Answer For Free Now!
View this answer and more for free by performing one of the following actions

Scan the QR code to install the App and get 2 free unlocks

Unlock quizzes for free by uploading documents