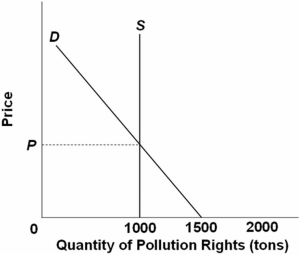
 Refer to the above diagram illustrating a market for pollution rights in which government has fixed the supply of rights at 1,000 tons.If the demand for pollution rights were to increase as a result of economic growth,the:
A) volume of pollutants discharged would increase.
B) price of pollution rights would increase.
C) supply curve would shift to the right.
D) demand curve would shift to the left.
Correct Answer:
Verified
Q14: Consumer surplus:
A) is the difference between the
Q49: A producer's minimum acceptable price for a
Q85: Q87: Amanda buys a ruby for $330 for Q89: The data in the table show the Q92: Graphically,producer surplus is measured as the area: Q93: The data in the table show the Q95: The air pollution policy of the United Q159: A market for pollution rights can be Q192: By requiring car producers to install emission![]()
A)
Unlock this Answer For Free Now!
View this answer and more for free by performing one of the following actions

Scan the QR code to install the App and get 2 free unlocks

Unlock quizzes for free by uploading documents