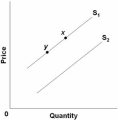
 Refer to the above diagram.A decrease in supply is depicted by a:
A) move from point x to point y.
B) shift from S1 to S2.
C) shift from S2 to S1.
D) move from point y to point x.
Correct Answer:
Verified
Q45: The demand curve for a product might
Q46: Q47: If consumers are willing to pay a Q51: When an economist says that the demand Q51: Suppose that tacos and pizza are substitutes,and Q53: In moving along a stable demand curve,which Q54: Suppose an excise tax is imposed on Q65: An increase in the quantity demanded means Q79: An increase in product price will cause Q98: The term "quantity demanded"![]()
A)
A)refers to the entire
Unlock this Answer For Free Now!
View this answer and more for free by performing one of the following actions

Scan the QR code to install the App and get 2 free unlocks

Unlock quizzes for free by uploading documents