Multiple Choice
 The graph above shows the production possibilities curve for an economy producing two goods,X and Y.Which of the points on the graph indicate unemployed resources?
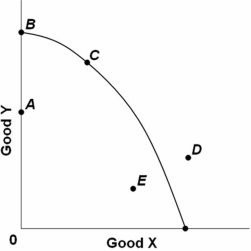
A) D only
B) E only
C) E and A only
D) B and C only
Correct Answer:
Verified
Related Questions
Q86: Q87: If an economy is producing at a Q88: The production possibility curve: Q89: The law of increasing opportunity costs indicates Q90: If an economy that produces capital and Q92: The production possibilities curve bows outward from Q93: Consider a society that is producing inside![]()
A) is convex to
Unlock this Answer For Free Now!
View this answer and more for free by performing one of the following actions

Scan the QR code to install the App and get 2 free unlocks

Unlock quizzes for free by uploading documents