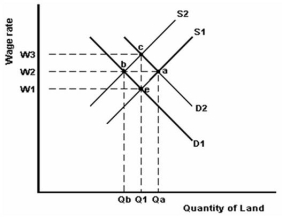
-Refer to the graph above to answer this question.Suppose that the original supply and demand curves for labour are S1 and D1 and that the market is in equilibrium at point e.What can you conclude has happened if a new equilibrium at b occurs?
A) The supply of labour,the wage rate and the equilibrium quantity have all increased.
B) Both the demand for labour and the wage rate have increased while the equilibrium quantity has decreased.
C) The wage rate and the equilibrium quantity have increased while the supply of labour has decreased.
D) The wage rate has increased while both the supply of labour and the equilibrium quantity have decreased.
E) The wage rate and the equilibrium quantity have increased while both the demand for and the supply of labour has increased.
Correct Answer:
Verified
Q39: The first 3 columns of the following
Q40: The first 3 columns of the following

