Below is a graphical illustration of a typical firm operating in a monopolistically competitive industry:
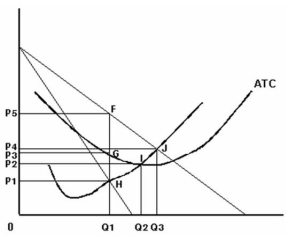
-Refer to the graph above to answer this question.Which of the following statements is correct?
A) This graph illustrates a short-run situation and some firms will soon exit from the industry.
B) This graph illustrates a short-run situation and new firms will soon enter the industry.
C) This graph illustrates a long-run situation and some firms will soon exit from the industry.
D) This graph illustrates a long-run situation and new firms will soon enter the industry.
E) This graph illustrates what could be either a short-run or a long-run situation.
Correct Answer:
Verified
Q9: Below is a graphical illustration of a
Q10: Below is a graphical illustration of a
Q11: Which term best describes the attempt by
Q12: Below is a profit pay-off matrix for
Q13: All of the following,except one,are examples of
Q15: What is a concentration ratio?
A)A ratio that
Q16: Below is a graphical illustration of a
Q17: Below is a profit pay-off matrix for
Q18: What measures the percentage of an industry's
Q19: Below is a graphical illustration of a
Unlock this Answer For Free Now!
View this answer and more for free by performing one of the following actions

Scan the QR code to install the App and get 2 free unlocks

Unlock quizzes for free by uploading documents