Below is a graphical illustration of a typical firm operating in a monopolistically competitive industry:
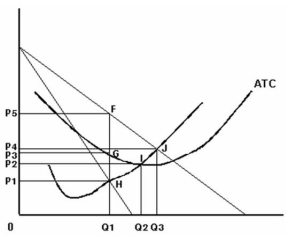
-Refer to the graph above to answer this question.Which of the following will be a result of the situation illustrated in the graph above?
A) The market demand curve will shift to the left.
B) The market demand curve will shift to the right.
C) The market supply curve will shift to the left.
D) The market supply curve will shift the right.
Correct Answer:
Verified
Q34: How are a typical monopolistically competitive firm
Q35: Which of the following statements concerning a
Q36: What does excess capacity mean?
A)The situation where
Q37: Why is it impossible for a monopolistically
Q38: The following graph shows the costs and
Q40: The following graph shows the costs and
Q41: Below are data for a monopolistically competitive
Q42: Which of the following variants of oligopoly
Q43: Below is a profit pay-off matrix for
Q44: What is the term for an industry
Unlock this Answer For Free Now!
View this answer and more for free by performing one of the following actions

Scan the QR code to install the App and get 2 free unlocks

Unlock quizzes for free by uploading documents