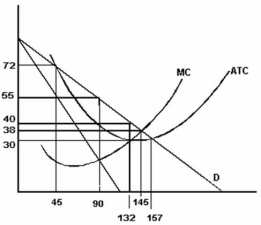
-Refer to the graph above to answer this question.What is the firm's profit or loss at its optimum price and output?
A) A loss of $1,015.
B) A loss of $1,350.
C) $0.
D) A profit of $1,350.
E) A profit of $1,584.
Correct Answer:
Verified
Q18: What measures the percentage of an industry's
Q19: Below is a graphical illustration of a
Q20: Below is a profit pay-off matrix for
Q21: The following graph shows the costs and
Q22: The following graph shows the costs and
Q24: The following graph shows the costs and
Q25: Which of the following statements is correct
Unlock this Answer For Free Now!
View this answer and more for free by performing one of the following actions

Scan the QR code to install the App and get 2 free unlocks

Unlock quizzes for free by uploading documents