The following graph shows the average and marginal revenue curves for a monopolist:
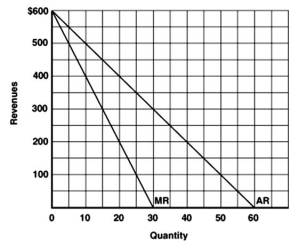
-Refer to the graph above to answer this question.At what output is total revenue maximized?
A) 30.
B) 40.
C) 50.
D) 60.
Correct Answer:
Verified
Q29: Which of the following statements regarding a
Q30: The following graph shows the average and
Q31: When is a monopolist's total revenue at
Q32: The following graph depicts the costs and
Q33: Where is a monopolist's profit maximized?
A)Where marginal
Q35: The following data refers to an unregulated
Q36: The following graph shows the average and
Q37: The following data relates to an unregulated
Q38: The following data refers to an unregulated
Q39: The following data relates to an unregulated
Unlock this Answer For Free Now!
View this answer and more for free by performing one of the following actions

Scan the QR code to install the App and get 2 free unlocks

Unlock quizzes for free by uploading documents