The following graph shows the market demand and average cost curve for electricity (in millions of kilowatts) in an urban centre:
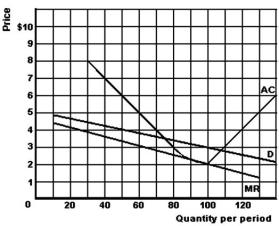
-Refer to the above graph to answer this question.Suppose that the price is $3,and the market is served by a monopolist.What quantity will be sold,and what will be the total profit or loss?
A) 75 and $0.
B) 80 and $40.
C) 100 and $100.
D) 110 and $0.
E) 110 and $27.50.
Correct Answer:
Verified
Q57: The following table gives the cost and
Q58: The following graph depicts the costs and
Q59: Assuming that average costs are the same
Q60: The following graph depicts the costs and
Q61: The following graph gives cost and revenue
Q63: The following graph gives cost and revenue
Q64: What is meant by the term fair-return
Q65: All of the following,except one,are ways that
Q66: The following graph gives cost and revenue
Q67: The following graph gives cost and revenue
Unlock this Answer For Free Now!
View this answer and more for free by performing one of the following actions

Scan the QR code to install the App and get 2 free unlocks

Unlock quizzes for free by uploading documents