Figure 10.10 depicts the cost and revenue curves for a monopolist.
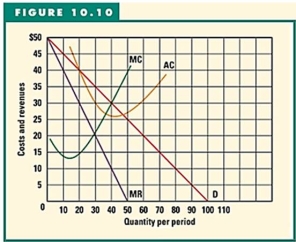
-Refer to Figure 10.10 to answer this question.What is the level of profits at the profit-maximizing output?
A) 0.
B) $20.
C) $150.
D) $450.
E) $600.
Correct Answer:
Verified
Q113: Table 10.5,which is data for a monopolist.
Q114: Under what circumstances will a profit-maximizing monopolist
Q115: Suppose a monopolist was charging a price
Q116: All of the following,except one,are examples of
Q117: Figure 10.10 depicts the cost and revenue
Q119: Figure 10.10 depicts the cost and revenue
Q120: Table 10.4 outlines the cost and revenue
Q121: A monopolist will only be able to
Q122: A monopolist is free to charge any
Q123: ![]()
Unlock this Answer For Free Now!
View this answer and more for free by performing one of the following actions

Scan the QR code to install the App and get 2 free unlocks

Unlock quizzes for free by uploading documents