The following graph shows the total variable costs and the total costs for a competitive producer:
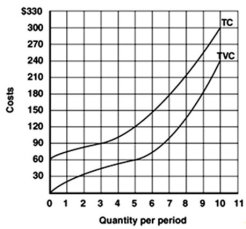
-Refer to the above graph to answer this question.What is the value of the break-even price?
A) 0.
B) $12.
C) $24.
D) $60.
E) $120.
Correct Answer:
Verified
Q27: The following graph shows the total variable
Q28: When is a competitive firm's profits maximized?
A)When
Q29: What is the term for the level
Q30: What is the term for the price
Q31: Assume that the following data is for
Q33: What is break-even price?
A)A price that just
Q34: What is shutdown price?
A)The price at which
Q35: Assume that the following data is for
Q36: What is the term for the price
Q37: Assume that the following data is for
Unlock this Answer For Free Now!
View this answer and more for free by performing one of the following actions

Scan the QR code to install the App and get 2 free unlocks

Unlock quizzes for free by uploading documents