The following graph shows the costs for a perfectly competitive producer:
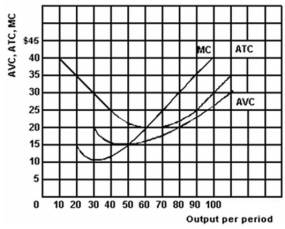
-Refer to the above graph to answer this question.Which of the following represents the firm's supply curve? 
A) Refer to table A
B) Refer to table B
C) Refer to table C
D) Refer to table D
Correct Answer:
Verified
Q46: The following graph shows the costs for
Q47: The total fixed costs of a perfectly-competitive
Q48: Assume that the following data is for
Q49: The following graph shows the costs for
Q50: The total fixed costs of a perfectly-competitive
Q52: The following questions are based on the
Q53: The following graph shows the costs for
Q54: The following graph shows the costs for
Q55: The following graph shows the costs for
Q56: The following questions are based on the
Unlock this Answer For Free Now!
View this answer and more for free by performing one of the following actions

Scan the QR code to install the App and get 2 free unlocks

Unlock quizzes for free by uploading documents