Graph A shows the market demand and supply in a perfectly competitive market.Graph B shows the cost curves of a representative profit-maximizing firm in that industry.
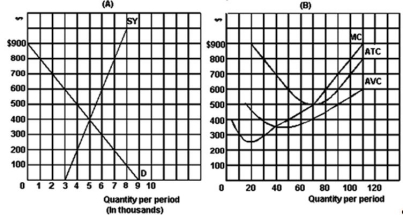
-Refer to the above graph to answer this question.Suppose that the industry demand were to increase by 3,000 units.What will be the new equilibrium price and quantity in the industry?
A) $400 and 8,000.
B) $500 and 8,000.
C) $600 and 6,000.
D) $700 and 6,500.
E) $800 and 7,000.
Correct Answer:
Verified
Q79: The following table shows the costs for
Q80: The following questions are based on the
Q81: The following graph (A)represents the cost curves
Q82: The following table shows the costs for
Q83: Graph A shows the market demand and
Q85: The following table shows the costs for
Q86: Graph A shows the market demand and
Q87: The following graph (A)represents the cost curves
Q88: Graph A shows the market demand and
Q89: The following graph (A)represents the cost curves
Unlock this Answer For Free Now!
View this answer and more for free by performing one of the following actions

Scan the QR code to install the App and get 2 free unlocks

Unlock quizzes for free by uploading documents