The table below contains short run average cost data for five different plant sizes for C3PO Technologies Ltd.

a)On the grid in the figure below,graph the short-run average cost curves for the five plants. 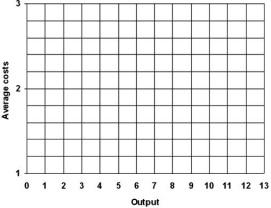
b)What is the right-size of plant for each of the following output levels:2,4,6,8 and 10?
c)Do a sketch of the long-run average cost curve in the graph above.
d)What plant size would C3PO need to use in order to achieve MES?
e)If C3PO is producing an output level of 6 in plant size 4,does excess capacity exist?
Correct Answer:
Verified
View Answer
Unlock this answer now
Get Access to more Verified Answers free of charge
Q1: Are diminishing marginal productivity and diseconomies of
Q97: In what sense might a firm be
Q98: A market can be too small if
Q99: While a firm can plan for the
Q100: Graphically,what is the effect of technological change?
A)The
Q103: State whether each of the following scenarios
Q104: Discuss the difference between increasing returns and
Q105: Demonstrate graphically and explain verbally the concepts
Q106: Suppose the inputs and outputs for Carbon
Q107: The table below shows cost data for
Unlock this Answer For Free Now!
View this answer and more for free by performing one of the following actions

Scan the QR code to install the App and get 2 free unlocks

Unlock quizzes for free by uploading documents