Multiple Choice
The graph below illustrates the average and marginal product of labour for Get Smart Enterprises.
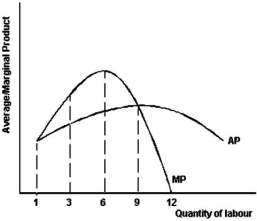
-Refer to the graph above to answer this question.How many units of labour does the firm need to employ to achieve an output that minimizes marginal cost?
A) 1.
B) 3.
C) 6.
D) 9.
E) 12.
Correct Answer:
Verified
Related Questions
Q51: The data in the table is for
Q52: The data in the table is for
Q53: Q54: The graph below illustrates the average and Q55: What is average variable cost? Q57: The data in the table is for Unlock this Answer For Free Now! View this answer and more for free by performing one of the following actions Scan the QR code to install the App and get 2 free unlocks Unlock quizzes for free by uploading documents![]()
A)Total fixed cost

