Multiple Choice
Below is a graphical representation of the wheat market in the distant land of Nod.
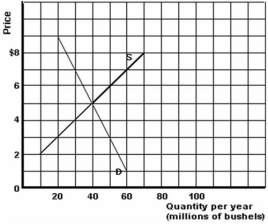
-Refer to the graph above to answer this question.What is the price elasticity of demand between the original equilibrium and the new equilibrium after the increase in supply of 30 million bushels?
A) 0.44.
B) 0.5.
C) 2.
D) 2.25.
Correct Answer:
Verified
Related Questions

