Which graph most appropriately shows the density of water plotted against temperature? 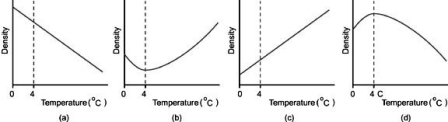
A) graph a
B) graph b
C) graph c
D) graph d
Correct Answer:
Verified
Q24: Describe what happens to an ice cube
Q25: Why is calcium chloride, Q26: Which of the following describes what happens Q27: Why does ice form at the surface Q28: Suppose that water is used in a Q30: When you increase the temperature of a Q31: What normally describes what happens when you Q32: What happens to the freezing temperature of Q33: Unlike fresh water, ocean water contracts as Q34: Is the density of near-freezing water, which![]()
Unlock this Answer For Free Now!
View this answer and more for free by performing one of the following actions

Scan the QR code to install the App and get 2 free unlocks

Unlock quizzes for free by uploading documents