The following table shows how apple output changes as additional apple pickers are hired.Calculate marginal physical product,total revenue,and marginal revenue product.The price of apples is $4 per basket.
Table 8.1-Apple Production 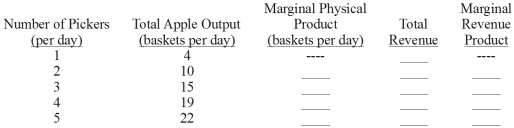
-In Table 8.1,if the price of apples increases to $10 per basket and the equilibrium wage is $40 per day,how many apple pickers will the firm hire?
A) 2.
B) 3.
C) 4.
D) 5.
Correct Answer:
Verified
Q80: If labor productivity rises,then wages:
A) Will decrease
Q81: The following table shows how apple output
Q82: The following table shows how apple output
Q83: The following table shows how apple output
Q84: Figure 8.1-Apple Production Q86: What do government imposed price floors not Q87: Figure 8.1-Apple Production Q88: When a worker's MRP is difficult to Q89: Unions influence a labor market by doing Q90: Figure 8.1-Apple Production Unlock this Answer For Free Now! View this answer and more for free by performing one of the following actions Scan the QR code to install the App and get 2 free unlocks Unlock quizzes for free by uploading documents![]()
![]()
![]()

