The histograms display the body fat percentages of 42 female students and 48 male students taking a college health course.For which of the variables depicted in the histograms would you be most satisfied to summarize the centre with a mean? Explain. 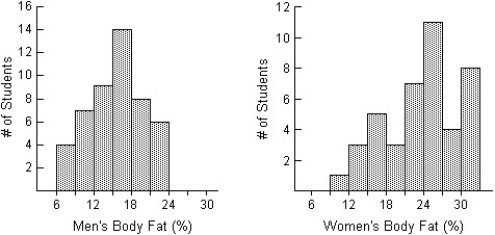
A) The histogram of Women's Body Fat is skewed on the left.That makes it the best candidate of summarizing with a mean.
B) The histogram of Women's Body Fat shows no outliers.That makes it the best candidate of summarizing with a mean.
C) The histogram of Men's Body Fat is most nearly symmetric,is not strongly skewed and shows no outliers.That makes it the best candidate of summarizing with a mean.
D) The histogram of Women's Body Fat is most nearly symmetric,is not strongly skewed and shows no outliers.That makes it the best candidate of summarizing with a mean.
E) The histogram of Men's Body Fat is skewed on the left.That makes it the best candidate of summarizing with a mean.
Correct Answer:
Verified
Q11: Office workers were asked how long it
Q13: The histogram shows the cost of living,in
Q15: The display shows the heights of Grade
Q17: Number of innings in the baseball games
Q17: The histogram shows the sizes (in acres)of
Q18: Office workers were asked how long it
Q19: The histogram shows the lengths of hospital
Q20: Here are summary statistics of the four
Q21: The histograms show the cost of living,in
Q28: A small company employs a supervisor at
Unlock this Answer For Free Now!
View this answer and more for free by performing one of the following actions

Scan the QR code to install the App and get 2 free unlocks

Unlock quizzes for free by uploading documents