The Back-To-Back Stem-And-Leaf Display Compares the Annual Precipitation,in Millimetres,of of Two
The back-to-back stem-and-leaf display compares the annual precipitation,in millimetres,of of two towns over a period of 14 years.The lower stem contains leaves with the digits 0-4 and the upper stem contains leaves with digits 5-9. 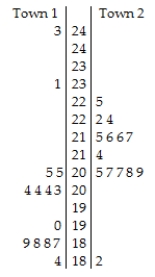
Key:
20 | 7 = 20.7 millimetres
A) The distribution of annual precipitation in Town 1 is bimodal,with one cluster centred around the mid 20s and another cluster in the high 18s.There are two high outliers of 23.1 and 24.3 mm for Town 1.In Town 2,the distribution of annual precipitation is unimodal and skewed right,clustered predominantly between 20.5 and 22.4.There is a low outlier of 18.2 mm for Town 2.The annual precipitation is generally higher and more sporadic in Town 1.
B) The distribution of annual precipitation in Town 1 is bimodal,with one cluster centred around the mid 20s and another cluster in the high 18s.There are two high outliers of 23.1 and 24.3 mm for Town 1.In Town 2,the distribution of annual precipitation is unimodal and skewed right,clustered predominantly between 20.5 and 22.4.There is a low outlier of 18.2 mm for Town 2.The annual precipitation is more consistent in Town 2;but overall,both cities have the same average annual precipitation.
C) The distribution of annual precipitation in Town 1 is bimodal,with one cluster centred around the mid 20s and another cluster in the high 18s.There are two high outliers of 23.1 and 24.3 mm for Town 1.In Town 2,the distribution of annual precipitation is unimodal and skewed left,clustered predominantly between 20.5 and 22.4.There is a low outlier of 18.2 mm for Town 2.The annual precipitation is generally higher and more consistent in Town 2.
D) The distribution of annual precipitation in Town 1 is bimodal,with one cluster centred around the mid 20s and another cluster in the high 18s.In Town 2,the distribution of annual precipitation is unimodal and skewed right,clustered predominantly between 20.5 and 22.4.The annual precipitation is generally higher and more consistent in Town 2.
E) The distribution of annual precipitation in Town 1 is bimodal,with one cluster centred around the mid 20s and another cluster in the high 18s.There are two high outliers of 23.1 and 24.3 mm for Town 1.In Town 2,the distribution of annual precipitation is unimodal and skewed right,clustered predominantly between 20.5 and 22.4.There is a low outlier of 18.2 mm for Town 2.The annual precipitation is generally higher and more consistent in Town 2.
Correct Answer:
Verified
Q1: Which class had the highest median score?
A)Class
Q5: For which class are the mean and
Q6: The centre for health in a certain
Q7: The histograms display the body fat percentages
Q7: Which class had the largest standard deviation?
A)Class
Q10: Match each class with the corresponding boxplot
Q11: Shown below are the boxplot and the
Q15: How would you describe the shape of
Q16: Which class had the smallest standard deviation?
A)Class
Q19: Which class had the smallest IQR?
A)Class 1,because
Unlock this Answer For Free Now!
View this answer and more for free by performing one of the following actions

Scan the QR code to install the App and get 2 free unlocks

Unlock quizzes for free by uploading documents