Shown below are the boxplot and summary statistics for the heights,in centimetres,of a class of Grade 3 students in Halifax,NS. 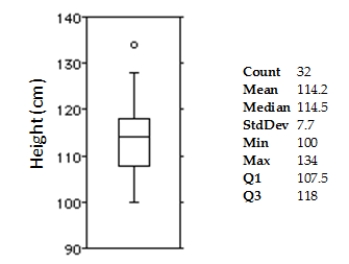
Which measures of centre and spread would you use for this distribution?
A) Median and standard deviation,because the outlier affects the mean.
B) Mean and standard deviation,because the outlier affects the mean.
C) Mean and IQR,because the outlier does not really affect the mean.
D) Median and IQR,because the outlier significantly affects the mean.
E) Mean and standard deviation,because the outlier does not really affect the mean.
Correct Answer:
Verified
Q33: The Ontario Ministry of Education collects data
Q34: Here are boxplots of the points scored
Q35: Office workers were asked how long it
Q36: Here are the summary statistics for mathematics
Q37: The boxplots display case prices (in dollars)of
Q39: The test scores of 15 students are
Q40: The boxplots display case prices (in dollars)of
Q41: The test scores of 40 students are
Q42: Here are the average mathematics achievement scores
Q43: The reaction time of 20 drivers at
Unlock this Answer For Free Now!
View this answer and more for free by performing one of the following actions

Scan the QR code to install the App and get 2 free unlocks

Unlock quizzes for free by uploading documents