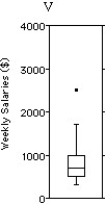
Shown below are the histogram and summary statistics for the weekly salaries (in dollars) of 24 randomly selected employees of a company: 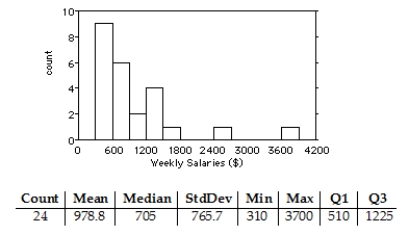
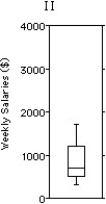
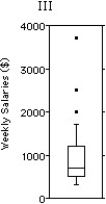
Choose the boxplot that represents the given data. 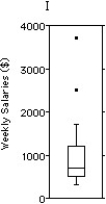

A) I
B) II
C) III
D) IV
E) V
Correct Answer:
Verified
Q52: The heights,in centimetres,of 18 randomly selected Grade
Q53: The normal annual precipitation (in millimetres)is given
Q54: The frequency table shows the weight,in kilograms,of
Q55: The weekly salaries (in dollars)of sixteen government
Q56: Here are the average mathematics achievement scores
Q58: The weekly salaries (in dollars)of 24 randomly
Q59: The following data consists of the heights,in
Q60: Here are the heights,in centimetres,of 32 Grade
Q61: The ages of the 21 members of
Q134: A local ice cream shop hand scoops
Unlock this Answer For Free Now!
View this answer and more for free by performing one of the following actions

Scan the QR code to install the App and get 2 free unlocks

Unlock quizzes for free by uploading documents