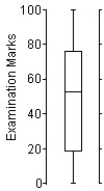
Here is an ogive of the distribution of students' marks on their statistics test. 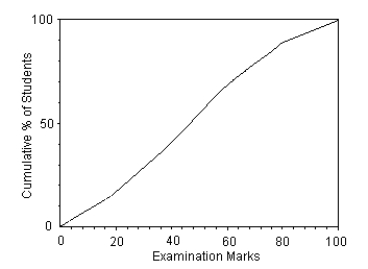
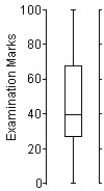
Choose the boxplot that represents the given data.
I II III 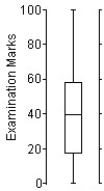
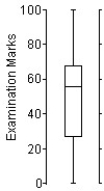
IV V 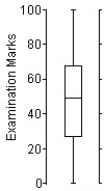
A) I
B) II
C) III
D) IV
E) V
Correct Answer:
Verified
Q61: The ages of the 21 members of
Q63: Here are summary statistics for the time,in
Q65: The normal monthly precipitation (in inches)for August
Q68: Shown below are the data and summary
Q69: Here are some statistics for the annual
Q70: Here are some summary statistics for all
Q71: Here are summary statistics for the time,in
Q105: A local ice cream shop hand scoops
Q134: A local ice cream shop hand scoops
Q137: The free throw percentages for participants in
Unlock this Answer For Free Now!
View this answer and more for free by performing one of the following actions

Scan the QR code to install the App and get 2 free unlocks

Unlock quizzes for free by uploading documents