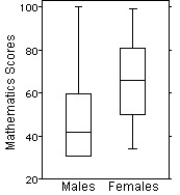
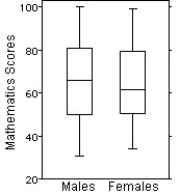
Here are the summary statistics for mathematics scores for one high-school graduating class. 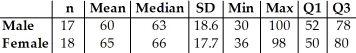
Choose the boxplot that represents the given data.
I II III 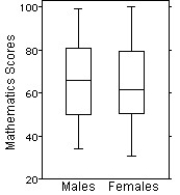

IV V 
A) I
B) II
C) III
D) IV
E) V
Correct Answer:
Verified
Q70: Here are some summary statistics for all
Q71: Here are summary statistics for the time,in
Q72: Shown below are the boxplot,the histogram and
Q73: Here are summary statistics for the time,in
Q74: Shown below are the boxplot,the histogram and
Q76: Here are the summary statistics for the
Q78: The weekly salaries (in dollars)of 24 randomly
Q79: Here are some summary statistics for all
Q80: Shown below are the boxplot,the histogram and
Q126: The speed vehicles travelled on a local
Unlock this Answer For Free Now!
View this answer and more for free by performing one of the following actions

Scan the QR code to install the App and get 2 free unlocks

Unlock quizzes for free by uploading documents