The following stem-and-leaf display shows the number of homeless cats and dogs that had to be euthanized each year in a large city for the period 1985-2004.Use both the stemplot and timeplot to describe the distribution. 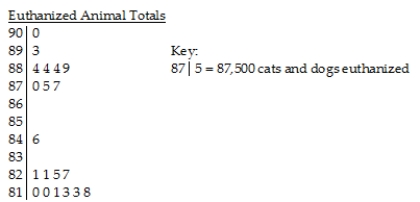
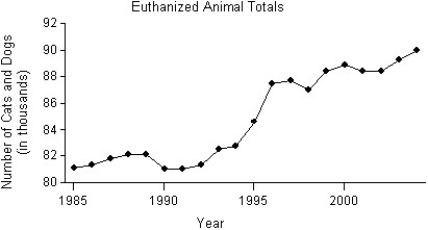
A) The distribution of the number of cats and dogs that were euthanized is skewed to the right,and has several modes,with gaps in between.One mode is clustered between 87,000 and 90,000 euthanized,a second mode at 84,000,and a third mode with a cluster between 81,000 and 82,000.The timeplot shows that the number of animals euthanized has increased over the period 1985-2004,with a significant increase between 1994 and 1996.
B) The distribution of the number of cats and dogs that were euthanized is bimodal.The upper cluster is between 87,000 and 90,000 euthanized,with a centre at around 88,400.The lower cluster is between 81,000 and 82,000 euthanized,with a centre at around 81,000.The timeplot shows that the number of animals euthanized has decreased over the period 1985-2004,with a significant decrease between 1994 and 1996.
C) The distribution of the number of cats and dogs that were euthanized is bimodal.The upper cluster is between 87,000 and 90,000 euthanized,with a centre at around 88,400.The lower cluster is between 81,000 and 82,000 euthanized,with a centre at around 81,000.The timeplot shows that the number of animals euthanized has increased over the period 1985-2004,with a significant increase between 1994 and 1996.
D) The distribution of the number of cats and dogs that were euthanized is bimodal.The upper cluster is between 89,000 and 90,000 euthanized,with a centre at around 88,400.The lower cluster is between 81,000 and 82,000 euthanized,with a centre at around 81,000.The timeplot shows that the number of animals euthanized has increased over the period 1985-2004,with a significant increase between 1994 and 1996.
E) The distribution of the number of cats and dogs that were euthanized is skewed to the left,and has several modes,with gaps in between.One mode is clustered between 87,000 and 90,000 euthanized,a second mode at 84,000,and a third mode with a cluster between 81,000 and 82,000.The timeplot shows that the number of animals euthanized has increased over the period 1985-2004,with a significant increase between 1994 and 1996.
Correct Answer:
Verified
Q85: A medical study of the effects of
Q86: Here is the stem-and-leaf display of the
Q87: Use the Olympic gold medal performances in
Q88: The stem-and-leaf diagram shows the ages of
Q89: In May 2011,17 coffee shops in Vancouver
Q91: Here is a histogram of the assets
Q92: Here is the boxplot and an ogive
Q93: Here is a histogram of the assets
Q94: Use the high closing values of Naristar
Q95: Members of the Ontario Field Ornithologists (OFO)observe
Unlock this Answer For Free Now!
View this answer and more for free by performing one of the following actions

Scan the QR code to install the App and get 2 free unlocks

Unlock quizzes for free by uploading documents