A university radio station has been airing a public service announcement (PSA)that gives a telephone number students can call to get information on upcoming campus events.In order to determine the optimal number of times per day to run the PSA,the station has been counting the number of calls generated each day as a function of the number of times the PSA was aired.The results of the experiment are summarized in the table below. 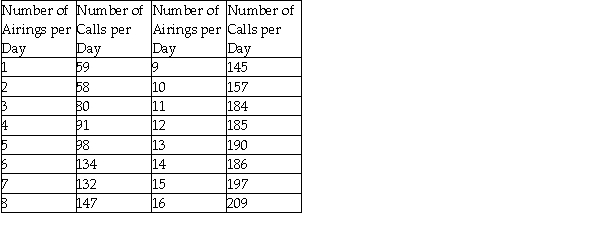
a)Re-express the data by squaring the number of calls per day,then plot the re-expressed data as a scatterplot. 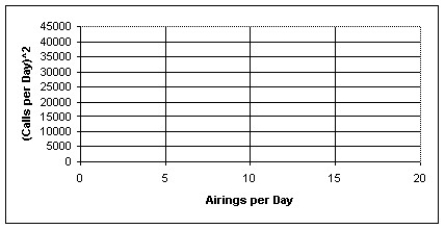
b)Determine the regression equation and correlation coefficient for the re-expressed data.
c)Interpret the slope of your model.Comment on the meaning and usefulness of this slope.
Correct Answer:
Verified
b)y = 2790.1x - 1524.4,R ...
View Answer
Unlock this answer now
Get Access to more Verified Answers free of charge
Q22: The relationship between two quantities X and
Q23: Dioxins are a class of long-lived and
Q24: The consumer price index (CPI)is a measure
Q25: The relationship between two quantities X and
Q26: The consumer price index (CPI)is a measure
Q28: Dioxins are a class of long-lived and
Q29: Dioxins are a class of long-lived and
Q30: The relationship between two quantities X and
Q31: A forester would like to know how
Q32: A company manufactures of polypropylene rope in
Unlock this Answer For Free Now!
View this answer and more for free by performing one of the following actions

Scan the QR code to install the App and get 2 free unlocks

Unlock quizzes for free by uploading documents