The table below shows the age and favorite type of music of 668 randomly selected people.Use a 5% level of significance. 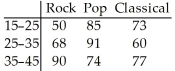

= 12.954;P-value = 0.0115
A) Reject the null hypothesis and conclude that the age distribution is not the same for each type of music.
B) Do not reject the null hypothesis and conclude that the age distribution is the same for each type of music.
C) Do not reject the null hypothesis and conclude that the age distribution is not the same for each type of music.
D) Reject the null hypothesis and conclude that the age distribution is uniform for each type of music.
E) Reject the null hypothesis and conclude that the age distribution is the same for each type of music.
Correct Answer:
Verified
Q13: When performing a chi-square goodness-of-fit test, how
Q48: What is the null hypothesis for the
Q56: A car insurance company performed a study
Q57: 160 students who were majoring in either
Q58: Responses to a survey question are broken
Q59: Use the sample data below to test
Q60: The table below shows the age and
Q62: A researcher wishes to test whether the
Q63: Research is conducted regarding the average age
Q65: In order to test a claim about
Unlock this Answer For Free Now!
View this answer and more for free by performing one of the following actions

Scan the QR code to install the App and get 2 free unlocks

Unlock quizzes for free by uploading documents