The table below displays data showing weight gain,in grams,for nine young rats,three from each of three litters.Three different diets (the treatments)were assigned at random to the three siblings in litter one (block 1).This was repeated for the other two litters (blocks 2 and 3). 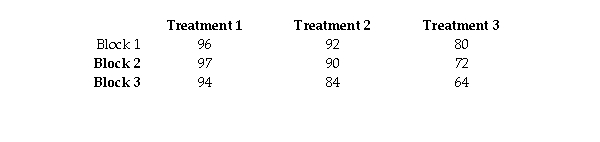
Conduct a Friedman test at the 0.05 level of significance to determine if there are differences between the three diets.
Correct Answer:
Verified
View Answer
Unlock this answer now
Get Access to more Verified Answers free of charge
Q2: Fifty (50)students took a math test before
Q12: A researcher was interested in comparing the
Q13: A coach uses a new technique in
Q14: A person who commutes to work is
Q15: To see how much of a difference
Q18: Five students took a math test before
Q19: A test of abstract reasoning is given
Q20: 11 female employees and 11 male employees
Q21: A scientist collects data to predict the
Q22: Two different tests are designed to measure
Unlock this Answer For Free Now!
View this answer and more for free by performing one of the following actions

Scan the QR code to install the App and get 2 free unlocks

Unlock quizzes for free by uploading documents