The following pictures represent solutions that contain a weak acid HA (pKa = 5.0) and its potassium salt KA.Unshaded spheres represent H atoms,black spheres represent oxygen atoms,and shaded spheres represent A- ions.(K+,H3O+ initially present,OH- initially present and solvent water molecules have been omitted for clarity. ) 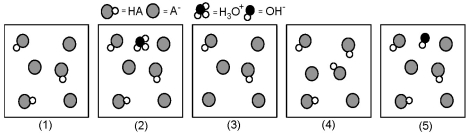
-Which picture represents the equilibrium state of the solution after addition of one OH- ion to the solution shown in picture (1) ?
A) (2)
B) (3)
C) (4)
D) (5)
Correct Answer:
Verified
Q81: The following plot shows two titration curves,each
Q82: The following plot shows two titration curves,each
Q83: Use the graphs below to answer the
Q84: The following plot shows two titration curves,each
Q85: The following pictures represent solutions at various
Q87: The following pictures represent solutions at various
Q88: The following pictures represent solutions at various
Q89: The following plot shows two titration curves,each
Q90: The following plot shows two titration curves,each
Q91: Use the graphs below to answer the
Unlock this Answer For Free Now!
View this answer and more for free by performing one of the following actions

Scan the QR code to install the App and get 2 free unlocks

Unlock quizzes for free by uploading documents