Which of the following is the typical shape of a plot showing the rate of an enzyme-catalyzed reaction as a function of the enzyme concentration with excess substrate?
A) 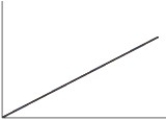
B) 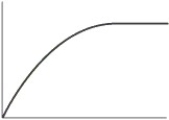
C) 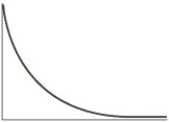
D) 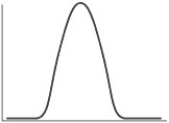
Correct Answer:
Verified
Q22: When substrate molecules occupy all of the
Q29: Which of the following does not generally
Q34: When an enzyme is saturated it
A)has been
Q38: Enzymes have an optimum temperature for their
Q40: The theory of enzyme mechanism that suggests
Q40: Explain the term feedback as a mechanism
Q49: Enzymes that are affected by the binding
Q52: When a molecule similar to the correct
Q64: All of the following statements concerning vitamins
Q76: The genetic control strategy of enzyme control
Unlock this Answer For Free Now!
View this answer and more for free by performing one of the following actions

Scan the QR code to install the App and get 2 free unlocks

Unlock quizzes for free by uploading documents