Which of the following is the typical shape of a plot showing the rate of an enzyme-catalyzed reaction as a function of the enzyme concentration with excess substrate?
A) 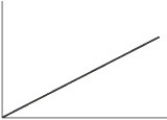
B) 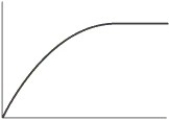
C) 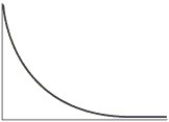
D) 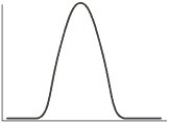
Correct Answer:
Verified
Q25: Which factor is not important in explaining
Q26: An enzyme that catalyzes the conversion of
Q27: When there is an increase in temperature
Q28: An enzyme that catalyzes addition or removal
Q29: Which of the following does not generally
Q31: A model that explains how the substrate
Q32: The theory of enzyme mechanism that suggests
Q33: In a normal biochemical system,the rate of
Q34: When an enzyme is saturated it
A)has been
Q35: Which of these factors explain how an
Unlock this Answer For Free Now!
View this answer and more for free by performing one of the following actions

Scan the QR code to install the App and get 2 free unlocks

Unlock quizzes for free by uploading documents