The figure shows an energy level diagram for the hydrogen atom. Several transitions are shown and are labeled by letters. 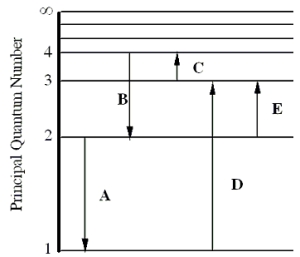 Note: The diagram is not drawn to scale.
-Determine the wavelength of the radiation involved in transition B.
A) 291 nm
B) 364 nm
C) 487 nm
D) 652 nm
E) 1910 nm
Correct Answer:
Verified
Q60: Name the physicist credited with the following
Q61: An argon-ion laser emits a blue-green beam
Q62: An atom will emit photons when one
Q63: Complete the following statement: In the laser-based
Q64: The figure shows an energy level diagram
Q66: The figure shows an energy level diagram
Q67: A pulsed laser has an average output
Q68: The figure shows an energy level diagram
Q69: Which one of the following statements best
Q70: The figure shows an energy level diagram
Unlock this Answer For Free Now!
View this answer and more for free by performing one of the following actions

Scan the QR code to install the App and get 2 free unlocks

Unlock quizzes for free by uploading documents