The figure shows the time variation of the magnitude of the electric field of an electromagnetic wave produced by a wire antenna. 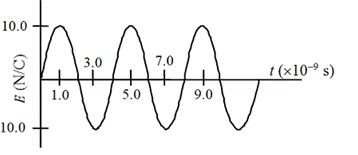
-What is the average intensity of this electromagnetic wave?
A) 0.13 W/m2
B) 0.26 W/m2
C) 0.33 W/m2
D) 0.36 W/m2
E) 0.54 W/m2
Correct Answer:
Verified
Q56: The electromagnetic wave of the radiation field
Q57: A linearly polarized electromagnetic wave is sent
Q58: A linearly polarized electromagnetic wave is sent
Q59: An FM radio station emits an electromagnetic
Q60: A linearly polarized electromagnetic wave is sent
Q61: The figure shows the time variation of
Q63: The figure shows the time variation of
Q64: The figure shows the time variation of
Q65: The figure shows the time variation of
Q66: The figure shows the time variation of
Unlock this Answer For Free Now!
View this answer and more for free by performing one of the following actions

Scan the QR code to install the App and get 2 free unlocks

Unlock quizzes for free by uploading documents